NASA Space Apps Challenge 2026
Orbit to Ground
Three working tools that turn NASA Earth observation data into decisions: when and where fire burns, where floodwater spreads under the clouds, and which crop rotation a field can sustain.
Three challenges, one approach
Pick a project. Each one runs live in your browser.
Every tool is interactive, built on public data and tested against simple baselines. Each one also lists what it doesn't do yet.
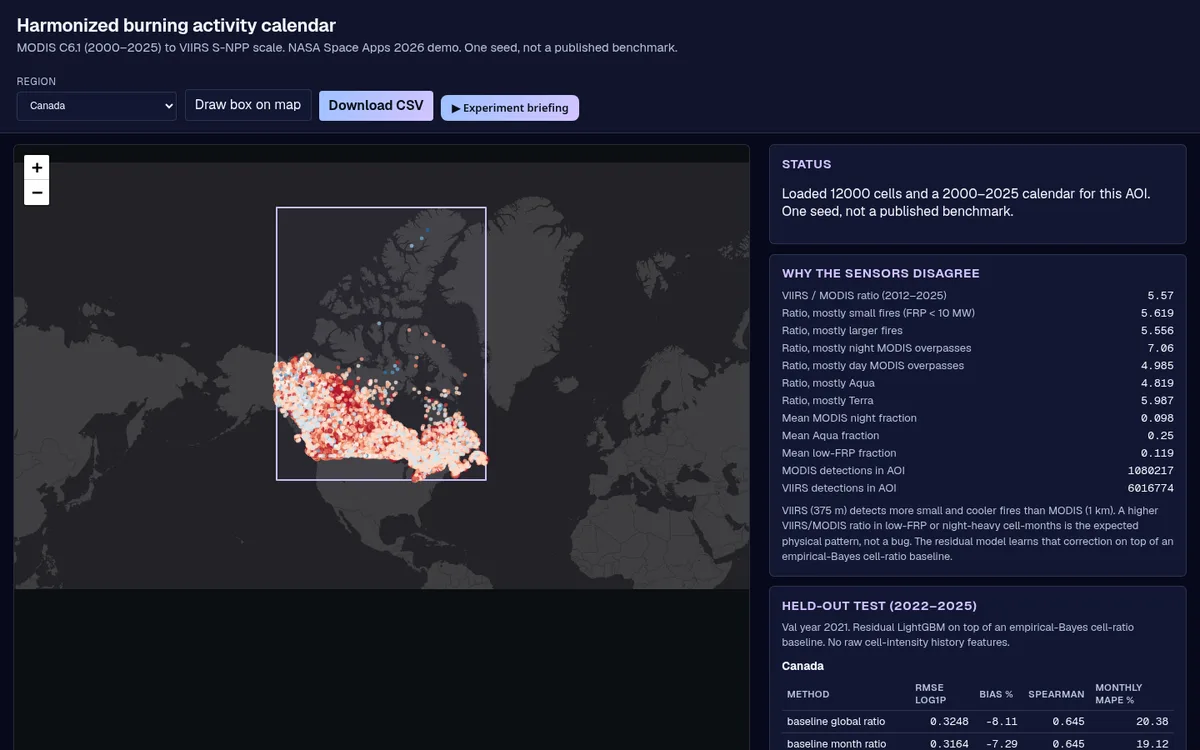
Hot Spots Harmonizer
One fire record from 2000 to 2025, on a single sensor scale.
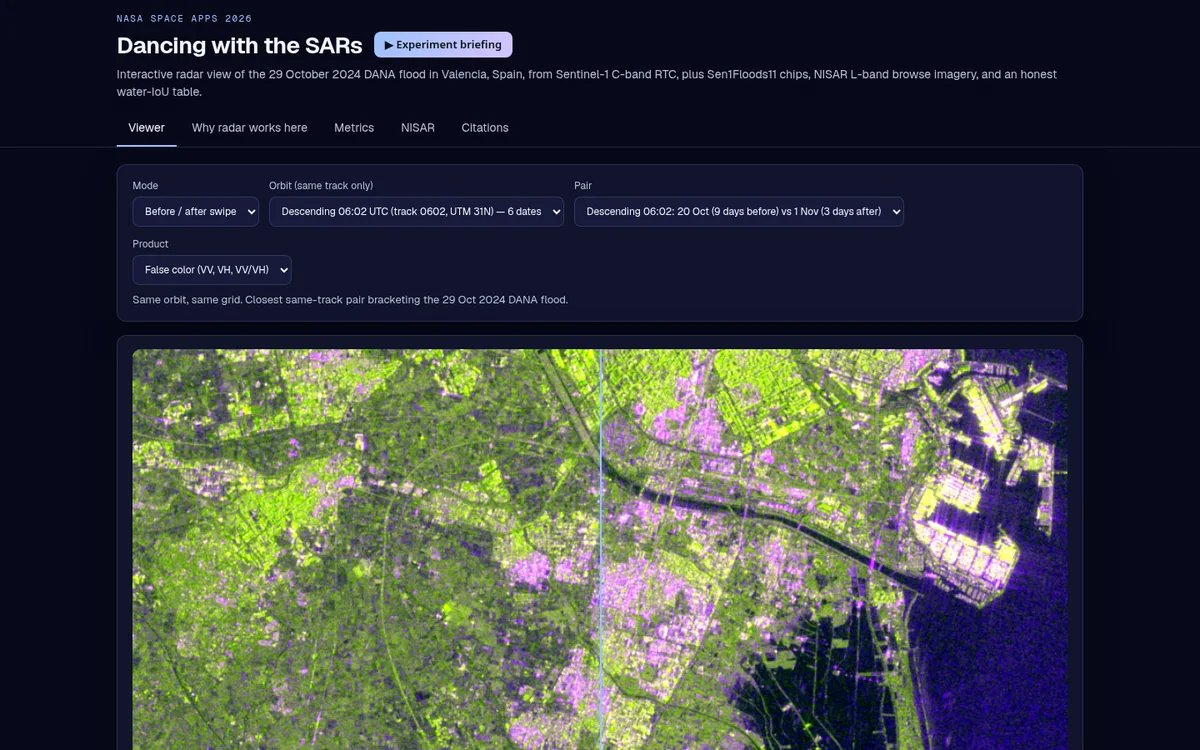
SAR Change: Valencia flood viewer
Radar sees the flood through the clouds. This viewer makes it readable.
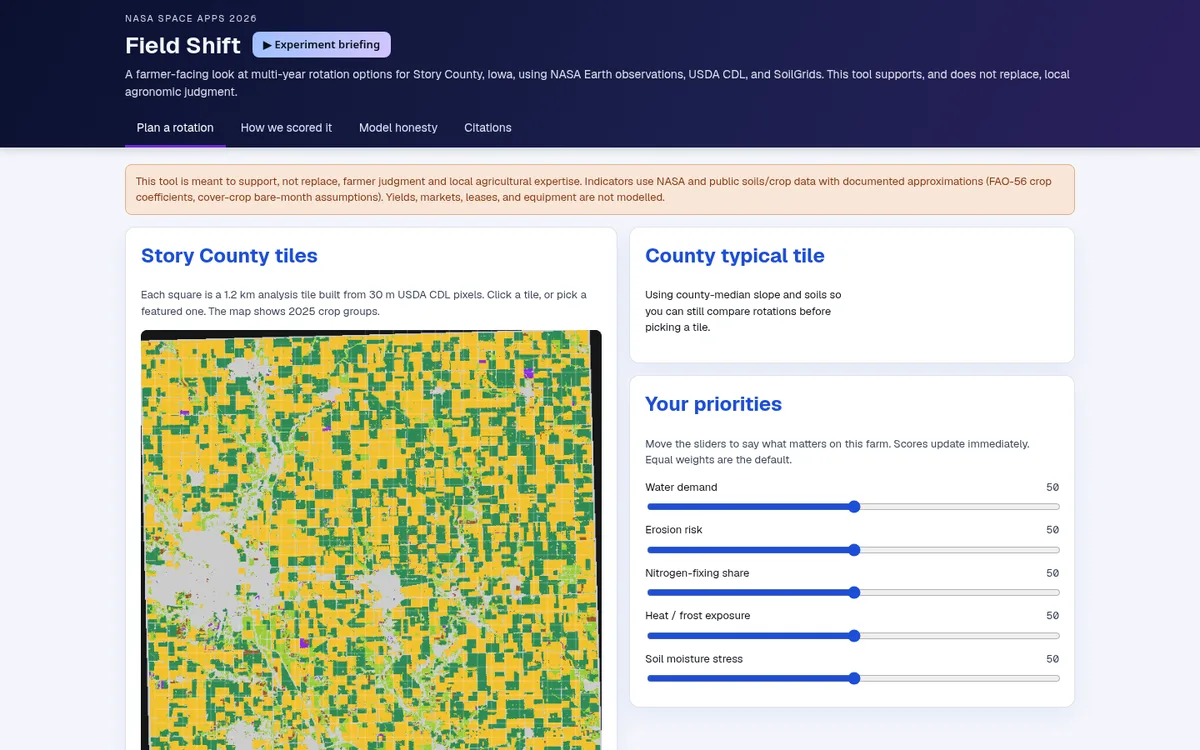
Field Shift: rotation explorer
Try a crop rotation on your field and see the trade-offs before you plant.
How we built them
The same three habits in every project
Simple first
Each model is compared with the obvious method a team would try first: a sensor ratio, an Otsu threshold, a Markov crop table. We report the gap either way.
Test on later years
We train on earlier years and test on later ones (2022–2025 for fire, 2024–2025 for crops), so the scores reflect how the tools would do on new data.
Honest scope
Uncertainty bands, negative results and limits sit next to the wins. Every number is one seed, and each page says so.
Open data
Built on NASA and partner data
For the judges
Scored on five criteria, 1 to 5 each
Each project page ends with a short section mapping the work to these criteria, from the 2026 Judging and Awards Guide.
Impact
Addresses a real problem, and how many people it could help.
Creativity
Original idea, or a meaningful improvement on existing ones.
Validity
Scientifically grounded, technically feasible and usable.
Relevance
Answers the challenge directly, with NASA data as a core part.
Presentation
Clear, engaging story of the challenge, the solution and why it matters.