Project 02 · Dancing with the SARs
SAR Change: Valencia flood viewer
Radar sees the flood through the clouds. This viewer makes it readable.
Interactive and fully static: everything runs in your browser from precomputed data. Use the "Experiment briefing" button inside the demo for a guided walkthrough.
The problem
Why it matters
Floods arrive with the storm, so optical satellites usually see only cloud. Synthetic aperture radar sees through cloud, day or night, but radar images are hard to read for anyone who isn't a specialist.
The challenge asks for an interactive app that uses NISAR radar to track and explain surface change. We take the 29 October 2024 DANA flood in Valencia, Spain, and make the change visible and explainable, with a path to NISAR L-band.
The approach
Stack same-orbit radar
26 Sentinel-1 RTC passes over four orbit tracks around Valencia (Sept–Dec 2024). Each orbit shares one colour stretch, so the time-lapse doesn't flicker.
Show the change
Before/after swipe, time-lapse and a VV dB change map for three same-track pairs that bracket the flood.
Learn water from radar
A U-Net trained on Sen1Floods11's hand-labelled chips, tuned with 14 Optuna trials, and compared against Otsu and a global VV threshold.
Explain the physics
Why calm water looks dark, what VV and VH mean, and why NISAR's L-band can see flooding under vegetation where C-band can't.
Connect to NISAR
NISAR L2 GCOV granules found through NASA CMR (Valencia 55, Toronto 67, Jasper 76), with public browse images in the viewer and hooks for full NISAR files.
Before and after
The flood, through the clouds
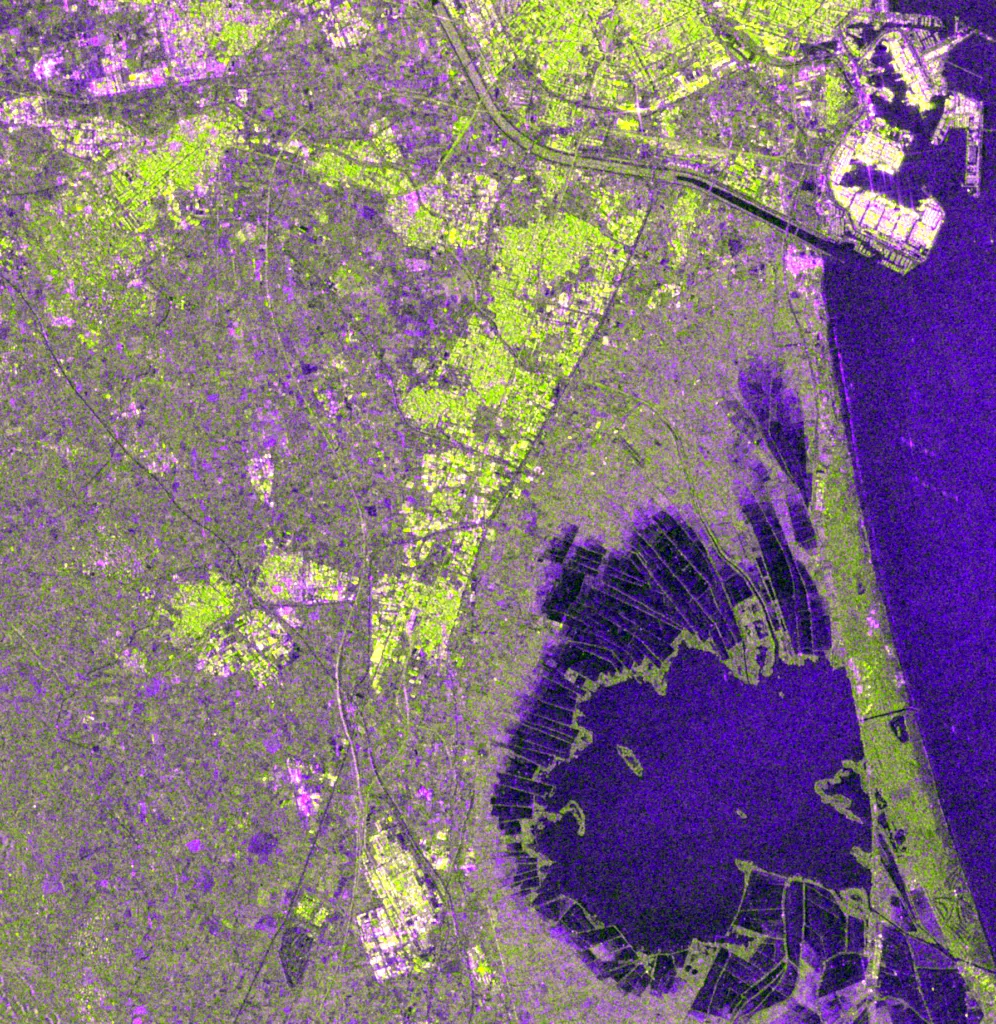
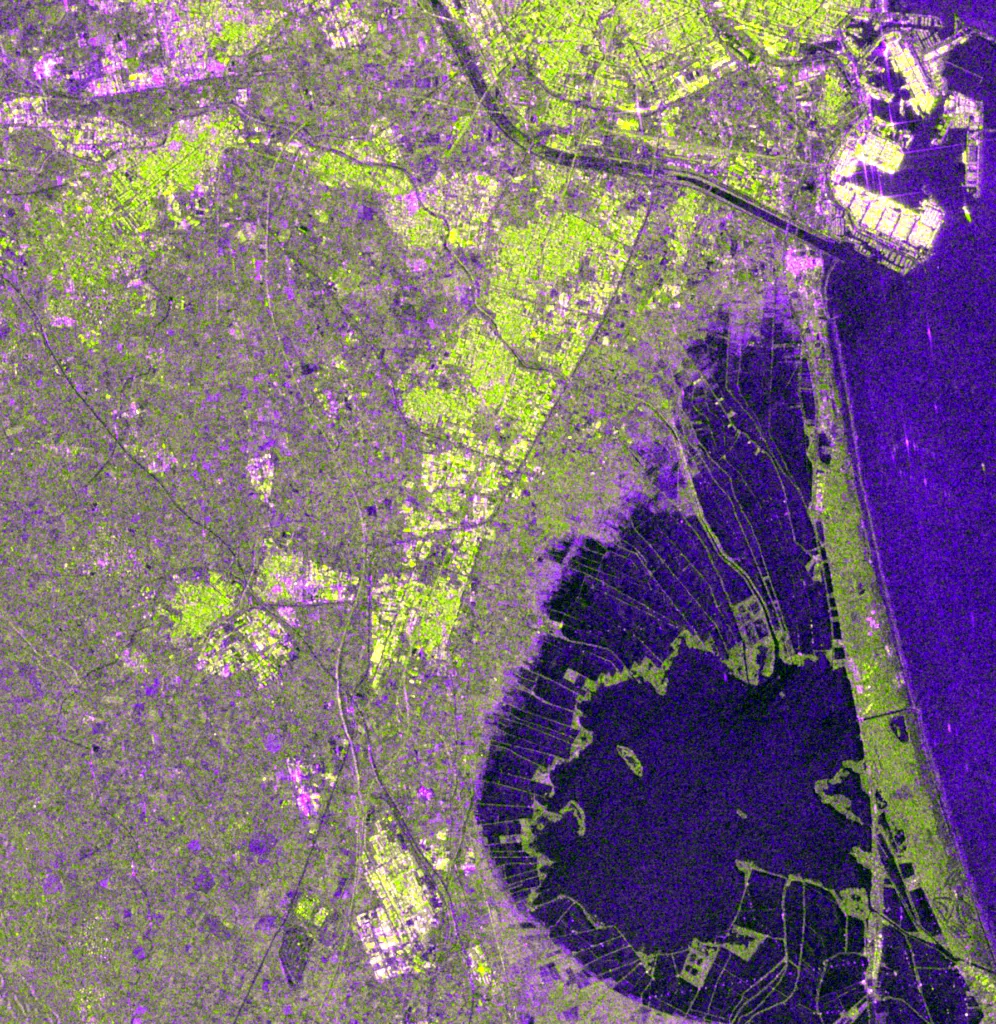 26 Oct 2024 (3 days before)7 Nov 2024 (9 days after)
Results
What the numbers say
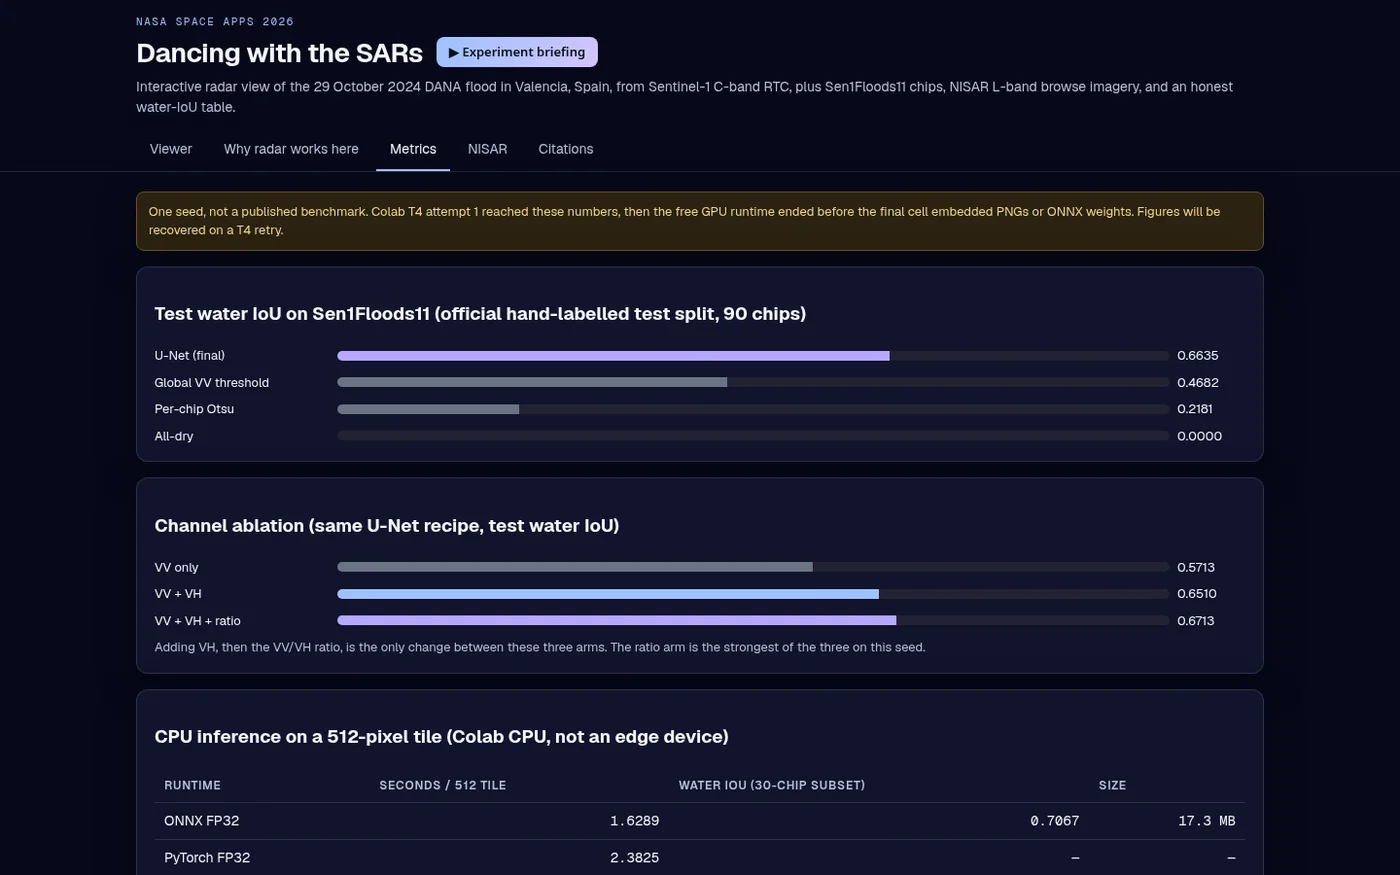
Held-out test data, compared against baselines. One seed per run, not a published benchmark.
U-Net water overlap on Sen1Floods11's official hand-labelled test split.
The standard automatic threshold, on the same chips. A single tuned VV threshold reaches 46.8%.
Channel ablation: adding VH and the VV/VH ratio each help.
Per 512×512 tile on a CPU. INT8 kept accuracy but was about 9× slower on that CPU, so FP32 stays.
Sentinel-1 radar passes in the Valencia viewer.
NISAR L2 GCOV granules found via NASA CMR over Valencia, Toronto and Jasper.
Visuals
Inside the tool
Data
NASA and partner data used
| Dataset | How it's used | Link |
|---|---|---|
| NASA-ISRO NISAR L2 GCOV (metadata + browse) | Granule search via NASA CMR; public browse images from ASF DAAC | source |
| Sentinel-1 RTC (ESA Copernicus) | VV/VH backscatter, 10 m, Valencia, Sept–Dec 2024; RTC via Microsoft Planetary Computer | source |
| Sen1Floods11 (CC-BY-4.0) | Hand-labelled Sentinel-1 flood chips (Bonafilia et al., 2020) | source |
| JRC Global Surface Water | Permanent-water reference overlay on the test chips | source |
For the judges
How it maps to the criteria
Floods are among the most costly disasters, and radar is often the only clear view during the event. Making SAR legible helps responders, journalists and the public.
Pairs an interactive swipe and time-lapse with a plain-language physics explainer, and is honest about what C-band can't see and L-band NISAR can.
Scored on Sen1Floods11's official hand-labelled test split, against two classical baselines, with a channel ablation and CPU timing.
Built around NISAR, the challenge's mission: real NISAR GCOV granules found via NASA CMR, browse imagery in the app, and hooks to load full NISAR products.
Swipe, time-lapse and a 'why radar works here' tab turn a specialist dataset into a story anyone can follow.
- One seed (Colab attempt 1); the free GPU session ended before the trained weights were saved, so the viewer shows recorded metrics, not live inference.
- The NISAR browse images are from 2025–2026, not the 2024 flood. NISAR launched after the event; the flood itself is shown with Sentinel-1.
- Full NISAR .h5 products need an Earthdata login and aren't bundled.