Project 03 · Field Shift: Adapting Farms with NASA Data
Field Shift: rotation explorer
Try a crop rotation on your field and see the trade-offs before you plant.
Interactive and fully static: everything runs in your browser from precomputed data. Use the "Experiment briefing" button inside the demo for a guided walkthrough.
The problem
Why it matters
Farmers face shifting rainfall, heat, frost and declining soil health, and the rotation they pick this year shapes the soil for years.
The challenge asks for a decision-support tool that combines NASA Earth observations with local soil, crop and farmer priorities. Field Shift does that for Story County, Iowa, at the scale of a 1.2 km tile.
The approach
Read the field's history
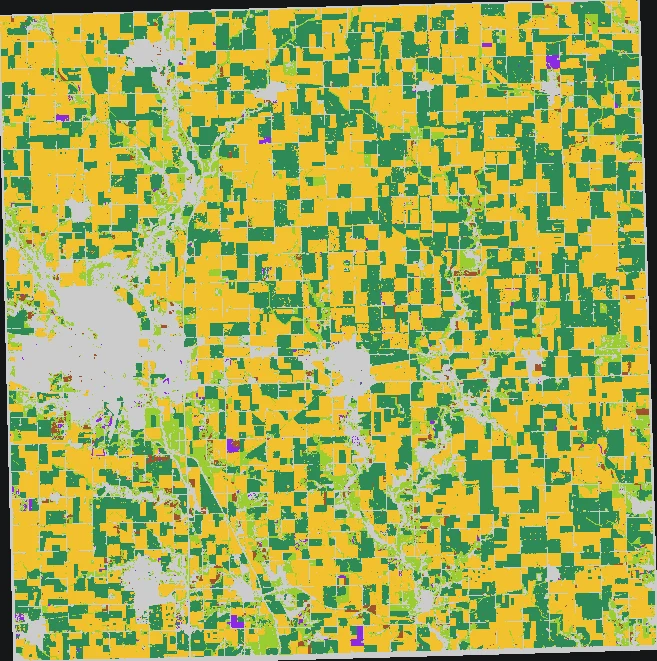
USDA Cropland Data Layer 2009–2025 at 30 m, grouped into 923 analysis tiles of 1.2 km.
Add NASA context
NASADEM slope, NASA POWER climate (growing-degree days, frost, heat, rainfall, root-zone wetness), MODIS NDVI bare-soil months and SoilGrids texture and carbon.
Predict next season
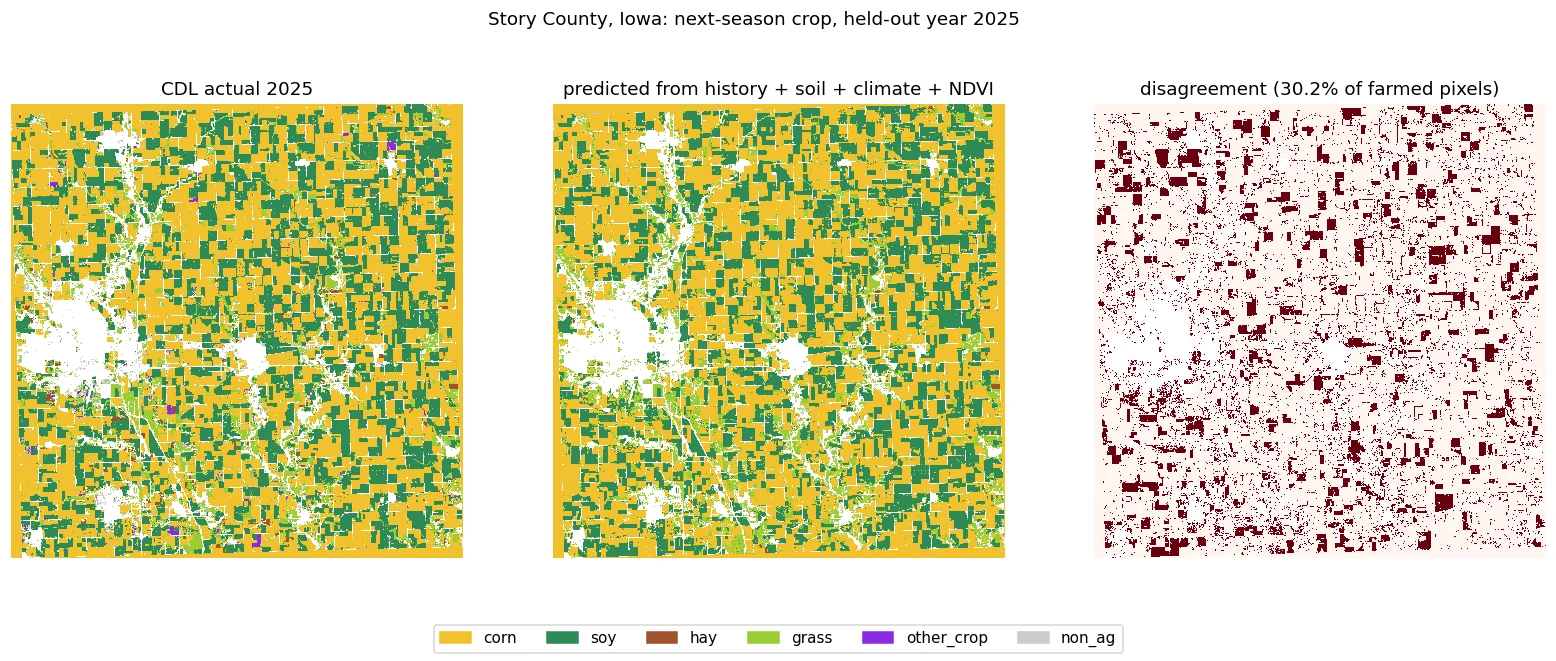
LightGBM predicts each pixel's next crop from five years of history plus terrain, soil, climate and NDVI. Trained to 2021, tuned on 2022–2023, tested on 2024–2025.
Score the trade-offs
Five indicators per rotation: water demand (FAO-56 crop coefficients), erosion risk, nitrogen-fixing share, heat/frost exposure and soil-moisture stress.
Search for better plans
Three reference rotations plus an NSGA-II search (48 individuals, 25 generations) that finds 36 non-dominated four-year plans. Sliders re-rank them by the farmer's own priorities.
Results
What the numbers say
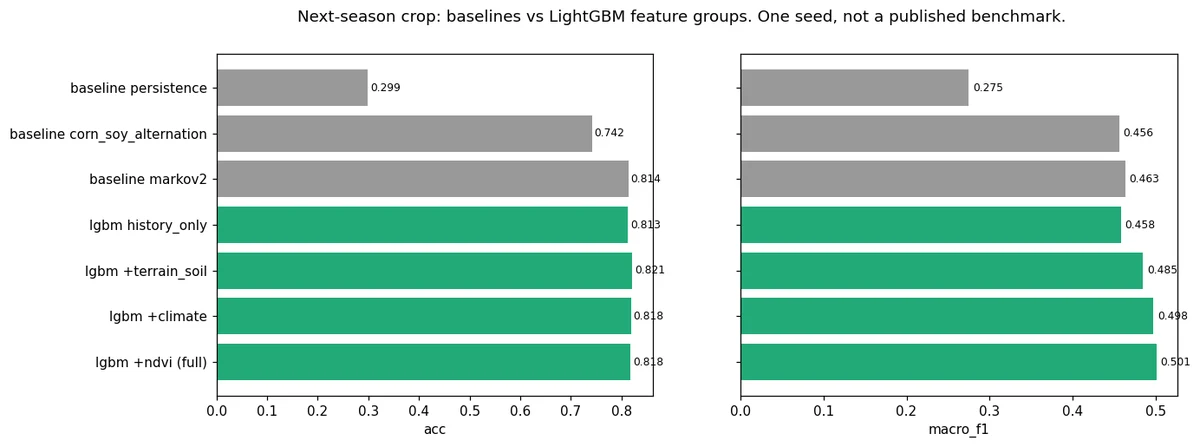
Held-out test data, compared against baselines. One seed per run, not a published benchmark.
Next-season crop accuracy on 66,666 held-out pixels (2024–2025).
Macro-F1 across six crop classes. Adding NASA terrain, soil, climate and NDVI to crop history lifts it from 0.4582.
Pixel accuracy of the full-county 2025 map.
Erosion-risk index of a cover-crop rotation vs the current corn-soy rotation (county-typical field).
Median growing-season rainfall used in the climate panel.
Honest miss: temperature scaling made calibration worse (ECE), so the tool keeps the raw probabilities. Hay F1 is 0.33 and the rare 'other crop' class is 0.
Visuals
Inside the tool
Data
NASA and partner data used
| Dataset | How it's used | Link |
|---|---|---|
| NASA POWER | Daily climate 2000–2024: temperature, rainfall, root-zone wetness | source |
| NASADEM | Elevation and slope (NASA JPL / LP DAAC) | source |
| MODIS MOD13Q1 NDVI | 16-day vegetation index; bare-soil months | source |
| USDA NASS Cropland Data Layer | 30 m crop maps 2009–2025 (public domain) | source |
| ISRIC SoilGrids | Clay, sand, organic carbon, pH, bulk density (CC-BY-4.0) | source |
For the judges
How it maps to the criteria
Helps farmers and advisers compare rotations on soil, water and climate risk, field by field, before committing a season.
Combines a next-season crop model with a multi-objective search, so farmers explore a trade-off frontier instead of getting one 'best' answer.
Temporal split, three baselines, ablation by data layer, calibration checks and per-class scores, including the classes it gets wrong.
NASA POWER, NASADEM and MODIS NDVI drive the indicators and the model; the tool matches the challenge's soil-health and rotation brief.
Click a tile, move five priority sliders and watch the ranked rotations update, with a plain-language note on each plan's benefits and risks.
- One seed per run; not a published benchmark. One county so far.
- Indicators are planning scores, not yield or evapotranspiration forecasts. Markets, leases and equipment aren't modelled.
- Cover crops aren't a CDL class; their effect on bare months is a documented assumption.
- SMAP, ECOSTRESS, GPM IMERG and GRACE aren't integrated yet (they need an Earthdata login).
- The tool supports farmer judgment and local agronomy; it doesn't replace them.