Project 01 · Harmonization of MODIS and VIIRS Hot Spots
Hot Spots Harmonizer
One fire record from 2000 to 2025, on a single sensor scale.
Interactive and fully static: everything runs in your browser from precomputed data. Use the "Experiment briefing" button inside the demo for a guided walkthrough.
The problem
Why it matters
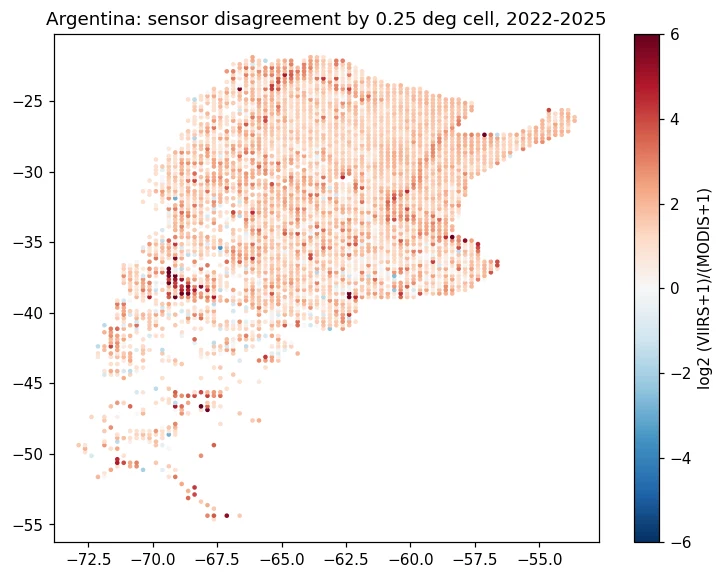
NASA has watched fires from orbit since 2000, but the record is split. MODIS (1 km pixels, from 2000) and VIIRS S-NPP (375 m pixels, from 2012) see fire differently: over Canada since 2012, VIIRS reports about 5.6 detections for every MODIS detection.
So a fire manager can't put a 2005 season next to a 2023 season and trust the comparison. The challenge asks for a web app that merges both records into a burning-activity calendar for any area of interest.
The approach
Grid every detection
NASA FIRMS country archives (MODIS C6.1 and VIIRS S-NPP) for Canada and Argentina, binned into 0.25° cell-months.
Start from an honest baseline
An empirical-Bayes ratio per cell: how many VIIRS detections each MODIS detection is worth there, shrunk towards the regional ratio.
Learn what the ratio misses
A LightGBM model corrects the baseline using MODIS fire power, day/night, Aqua/Terra and neighbouring months. Trained 2012–2020, tuned on 2021, tested on 2022–2025.
Say how sure it is
Conformalized quantile intervals, calibrated per MODIS-count stratum, with a 90% coverage target.
Back-cast and flag
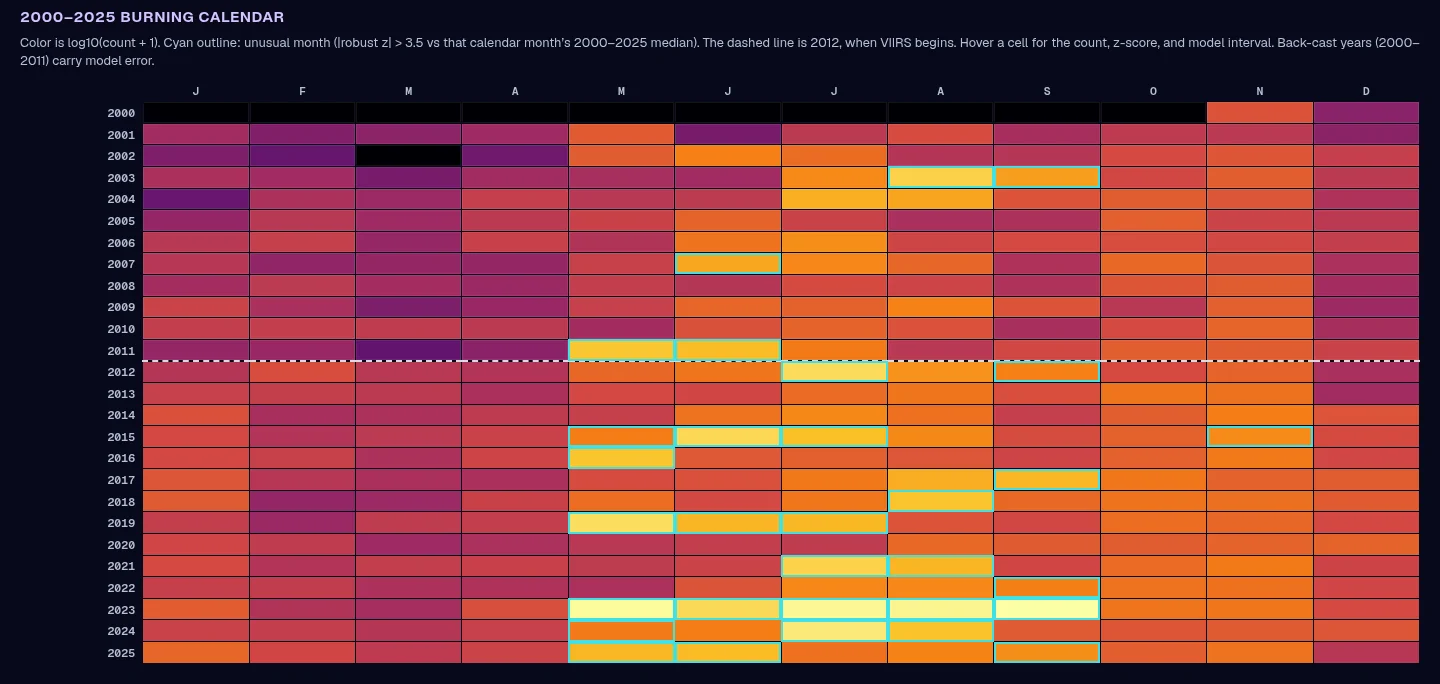
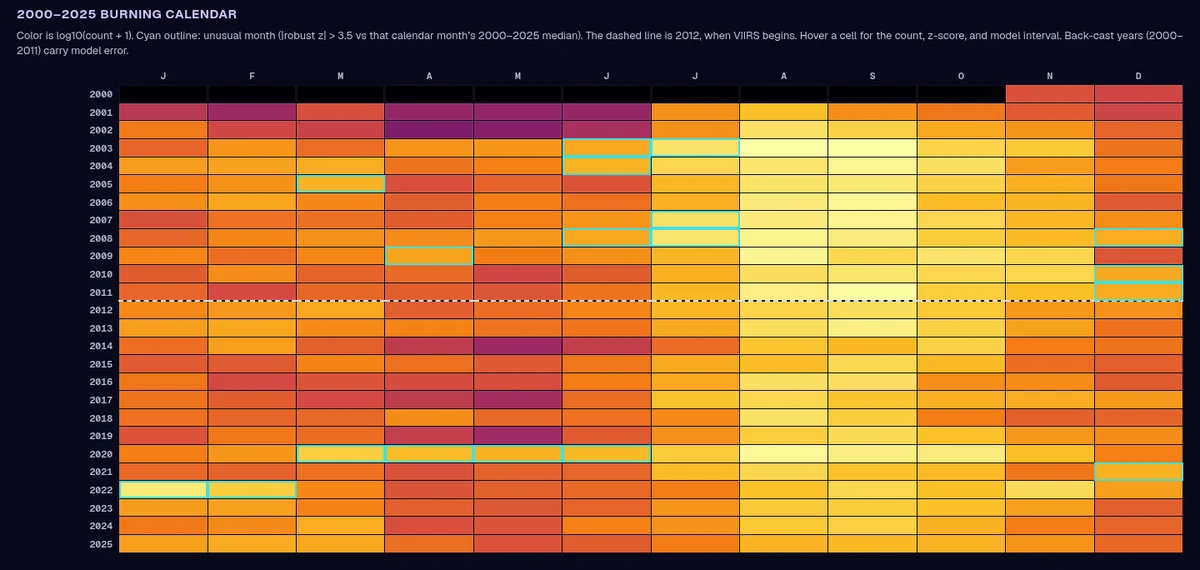
2000–2011 MODIS is converted to VIIRS scale. Unusual months are flagged with a robust z-score (|z| > 3.5 against that calendar month's 26-year median).
Put it in a browser
Pick a region or draw any box: the calendar, disagreement map and CSV export are computed client-side from precomputed tiles.
Results
What the numbers say
Held-out test data, compared against baselines. One seed per run, not a published benchmark.
Lower error than the best baseline on Canada's held-out 2022–2025 data (498,302 cell-months).
Lower error than the best baseline in Argentina (193,472 test cell-months). Total-count bias fell from −24.4% to −1.6% after 2021 calibration.
Interval coverage on cells where VIIRS saw fire, Canada. Argentina: 90.1%.
FIRMS detections behind the model (Canada and Argentina, 2000–2025).
Unusual months flagged across Canada's 26-year calendar.
Honest miss: monthly-total error in Canada is worse than the baseline, even though per-cell error is better. Argentina too (16.6% vs 12.2%). Both are shown in the demo.
Visuals
Inside the tool
For the judges
How it maps to the criteria
Gives fire managers and researchers a 26-year, single-scale fire calendar for any box on the map, so they can see whether a season is truly unusual.
Learns the cross-sensor correction on top of a strong per-cell baseline, rather than one global ratio, and attaches calibrated uncertainty to every back-cast month.
Strict time split (train 2012–2020, tune 2021, test 2022–2025), four baselines and coverage checks. It reports where it loses (Canada monthly totals) as well as where it wins.
Built entirely on NASA FIRMS MODIS and VIIRS records. It delivers exactly what the challenge asks for: a harmonized burning-activity calendar for an area of interest.
One-click presets, draw-your-own area, hover details, CSV export and a built-in briefing deck that explains each result in plain language.
- One seed per run; not a published benchmark.
- Two countries so far (Canada, Argentina). Only VIIRS S-NPP is used, not NOAA-20/21 yet.
- Intervals are summed over cells in the box; they are not a formal regional confidence interval.
- Back-cast years (2000–2011) carry model error and are labelled as such.